
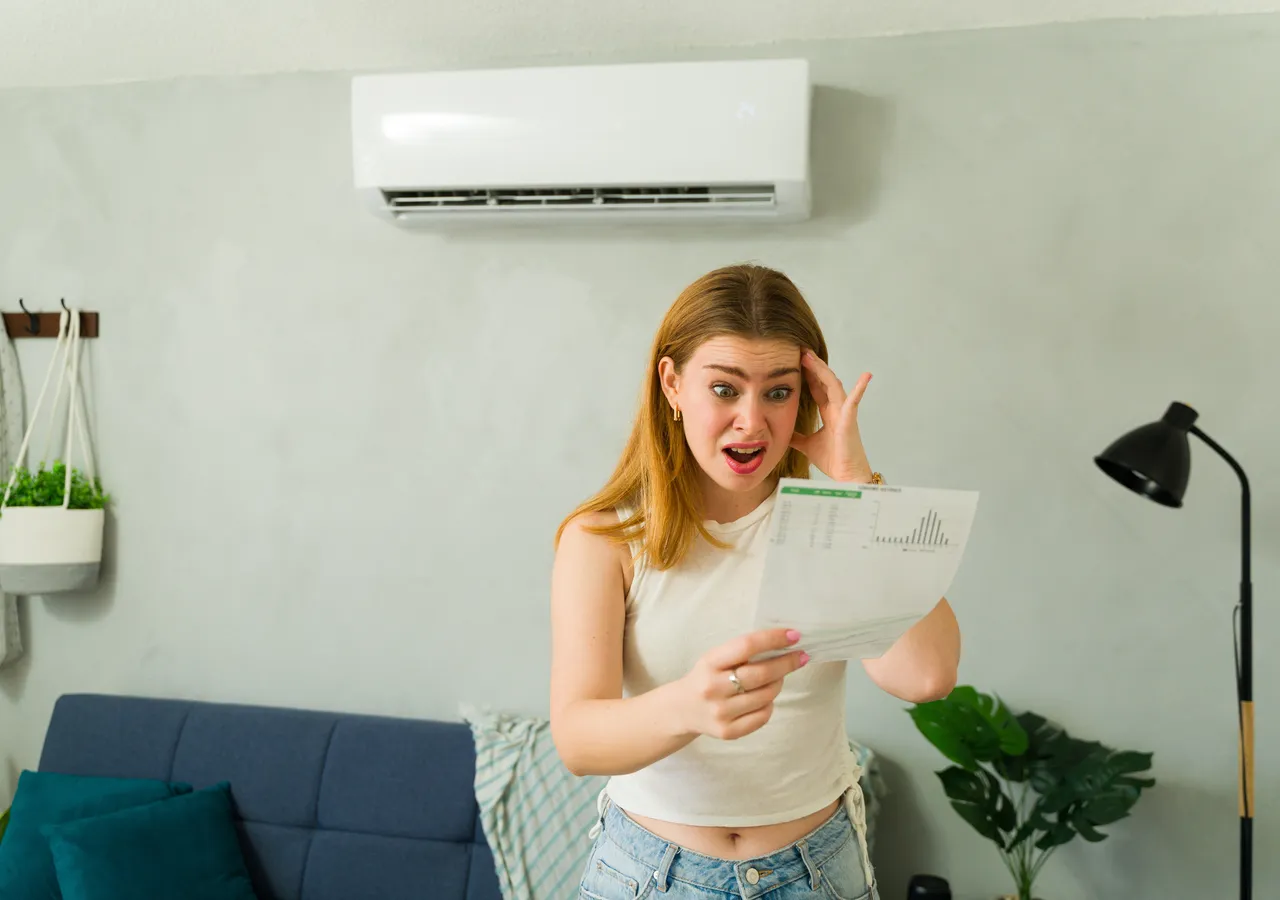
A high bill almost always has one of five causes
When a bill lands much higher than you expected, it feels random, but it almost never is. In Australia there are really only five things that push a bill up: you used more power, the discount or "benefit period" on your plan quietly ended, your retailer raised its rates, your tariff structure changed, or the season shifted and your heating or cooling did the damage. Often two of these land in the same quarter, which is why the jump can feel dramatic.
The good news is that each cause leaves a fingerprint on the bill itself. Before you assume you have been overcharged, it is worth spending ten minutes reading the bill properly, because the answer is usually printed on it. This article walks through how to tell the causes apart, and what to do about each one.
A quick note on billing shock: many bills are estimated, not based on an actual meter read. If a low estimate is followed by a real read, the "catch-up" can look like a spike when your usage never actually changed. Check whether your bill says "estimated" or "actual" before anything else.
Cause 1 & 2: more usage, or the season
Start with the usage graph. Almost every bill now shows a bar chart of your daily average usage in kWh, quarter by quarter, often next to the same period last year. If the current bar is clearly taller, you used more power. The rate is not the story. The most common reason is the weather. Air conditioning in a heatwave and electric heating in winter are by far the biggest loads in most homes, and they can double a quarterly bill without you changing anything else about how you live.
Look for one-off changes too: more people home, a new EV on charge overnight, a pool pump running longer over summer, a second fridge in the garage, or a faulty hot-water element cycling constantly. A single high-draw appliance running around the clock can add more than everything else combined.
If usage is up because of the season, that is normal and expected. The lever you can pull is efficiency and tariff, not blame. If usage is up for no reason you can explain, it is worth checking for a fault (see the FAQ on a bill that is high with no change in habits).
Cause 3 & 4: benefit period ended, or a rate rise
This is the sneaky one. Many market plans advertise a "conditional discount" or a "benefit period" that lasts 12 months. When it ends, you are rolled onto the higher standing rates: same plan, same retailer, no letter that feels like bad news, but a materially higher bill. If your usage graph is flat but the dollars went up, a lapsed benefit period is the prime suspect. Check the plan name and the "your rates" section against an older bill.
Separately, retailers reset their prices, usually around 1 July each year, in line with the regulated benchmarks (the Default Market Offer in NSW, SA and south-east QLD, and the Victorian Default Offer in VIC). A mid-year jump in the supply charge or c/kWh, with usage unchanged, points to a rate rise. This is the moment to compare, because the plan that was competitive last year may not be after a repricing.
Cause 4 is a tariff change, for example being moved from a single flat rate onto time-of-use when a smart meter was installed. If your bill suddenly shows "peak", "off-peak" and "shoulder" rates where it used to show one number, your structure changed, and your habits may no longer suit it.
Diagnose it in order, then act
- Check estimated vs actual: if the bill says "estimated", a later real read may explain a catch-up spike with no real change in usage.
- Read the usage graph: is your daily average kWh higher than last quarter and the same quarter last year? If yes, this is a usage/seasonal issue.
- Compare the plan name and rates against an older bill: a higher supply charge or c/kWh with flat usage means a rate rise or a lapsed benefit period.
- Look at the tariff type: single rate vs time-of-use vs demand. A new structure (often after a smart-meter swap) can change the maths even if nothing else did.
- Once you know the cause, compare your plan on your real usage. EnergySorted costs every plan against an uploaded bill, takes no retailer commission, and its Bill Health Score tells you at a glance whether you are overpaying.
Why comparing on your real bill matters here
The reason a high bill is so hard to fix by eye is that no two plans price the same way. One has a low usage rate but a high daily supply charge; another looks dear on paper but rewards overnight use. The only honest test is to cost every plan against your actual pattern of use, not the advertised headline.
That is exactly what EnergySorted does. It applies your real peak, off-peak, controlled-load and solar feed-in numbers (taken straight from your bill) across the whole market, so the comparison reflects what you would truly pay rather than the best-looking advertisement. Its bill forecasting can also project your next bill from your trend, so a spike stops being a surprise. Because it earns a flat subscription (around $39 a year) and no retailer commission, the ranking is not steered toward whoever pays the biggest kickback.
Frequently asked questions
My usage did not change but my bill went up. Why?
The most likely causes are a benefit or discount period ending, or a retailer rate rise (often around 1 July). Both raise the dollars with your usage flat. Compare the plan name, supply charge and c/kWh on your new bill against an older one to spot which. If both look the same, check whether the earlier bill was estimated and the new one is an actual read.
How can I tell if it is the season or a real problem?
Look at the usage graph on the bill and compare the current quarter to the same quarter a year ago. If summer or winter last year was similarly high, it is seasonal heating or cooling. If this quarter is far above the same period last year with no new appliances or people, investigate a fault. A stuck hot-water element or a failing fridge can run constantly.
What is a benefit period and why did it raise my bill?
Many market plans offer a discount or guaranteed rate for a fixed term, commonly 12 months, called a benefit period. When it ends you are moved onto higher standing rates automatically: same retailer, no obvious warning. A flat usage graph with higher dollars is the classic sign a benefit period has lapsed, and it is a good trigger to compare the market.
Could a faulty appliance be causing a high bill?
Yes. Hot-water systems with a failing element or thermostat, second fridges and freezers, and pool or bore pumps left running are common culprits because they draw power around the clock. If your smart meter data shows a high, flat overnight baseline, a constantly running appliance is the likely cause.
Will switching plans fix a high bill?
It fixes the part caused by rates: a lapsed benefit period, an uncompetitive plan or a poorly matched tariff. It cannot undo extra usage from a heatwave or cold snap. The smart move is to diagnose the cause first, then compare on your real usage so you at least stop overpaying on the rate side.
How does EnergySorted help diagnose a high bill?
You upload a recent bill and it reads your real usage, tariff and feed-in, then costs the whole market (every plan, no retailer commission) against those numbers. The Bill Health Score shows whether you are overpaying, and bill forecasting projects your next bill from your trend so future spikes are visible before they arrive.
How much should my electricity bill actually be?
It depends on your household size, state and season, but comparing against the average electricity bill in Australia gives you a rough benchmark. If yours is well above the typical range for your state and household, that gap is usually explained by heavy heating or cooling, a lapsed discount or an uncompetitive rate rather than anything mysterious.
Why did my rates go up on 1 July?
Most retailers reprice once a year around 1 July to track the regulated benchmarks, mainly the Default Market Offer in NSW, SA and south-east Queensland and the Victorian Default Offer. A mid-year jump in your supply charge or c/kWh with flat usage almost always points to this annual reset, and it is a good prompt to compare rather than accept the new price.
Could demand charges be behind the jump?
On some plans, yes. If your bill lists a separate charge in c/kW or $/kW based on your highest half-hour of usage, you are on a demand tariff. A single spike, such as the oven, air conditioner and dryer all running at once, can lift that charge for the whole period. Our guide to demand charges explains how to spot and flatten them.
How do I stop the next bill from being a shock?
Work through the practical ways to cut your power bill: shift big loads off the peak, seal draughts and put hot water on a cheap tariff, then make sure your rate is competitive. EnergySorted's bill forecasting also projects your next bill from your usage trend, so a spike is something you see coming rather than open in the post.
Should I switch retailers or just move to a new plan?
Sometimes your current retailer has a cheaper plan you can move to without leaving; other times a different retailer wins outright. Switching is simple and there is no interruption to supply, since nothing physical changes at your meter, so the decision comes down to which plan costs least on your real usage.