
The spreadsheet
Before EnergySorted existed, its founder compared energy plans the way a lot of careful people do: in a spreadsheet. It was built in June 2023 and last touched that October. Four columns, one per plan under consideration. Down the side, the things that decide a bill — an off-peak rate, a shoulder rate, a peak rate, a daily connection charge, and a feed-in tariff. At the bottom, a block of real usage typed out of three actual bills: a June bill, an October bill and a January bill.
The arithmetic was correct. Each plan cost was the off-peak rate times off-peak kilowatt-hours, plus the shoulder rate times shoulder kilowatt-hours, plus the peak rate times peak kilowatt-hours, plus the daily charge times the number of days. From that it subtracted the feed-in tariff times the kilowatt-hours exported. That is genuinely how a time-of-use bill works, and it is more rigour than most households ever apply.
The household in question used 560.62 kWh across a 31-day period, split 118.57 peak, 190.56 shoulder and 251.49 off-peak, while exporting 1,286.82 kWh of solar. On those numbers the spreadsheet picked a winner and the decision was made.
What it cost to run
The hidden expense of a spreadsheet like this is not the arithmetic, it is the data entry. Every rate in it had to be found on a retailer website, read off a plan summary, and typed in by hand — five figures per plan, per comparison. Every usage figure had to be read off a paper bill and split into its bands. And the whole thing had to be redone from scratch whenever a rate changed, which retailers are free to do at any time.
That is why the sheet compares four plans. Not because four is the right number, but because four is about as many as a person will realistically maintain by hand. The effort scales linearly and attention does not.
The same household, costed against the whole market
We took the exact usage figures out of that spreadsheet and put them through the comparison. On 22 September 2026, for that address on the Ausgrid network, there were 1,622 plans that could be costed on those numbers, from 28 different retailers.
The cheapest came to about $108 a month. The middle of the market — the median plan — came to about $218 a month. The gap between landing on the cheapest plan and landing on a merely average one was therefore around $110 a month, or roughly $1,300 a year, for a household that had already done more homework than most.
That spread is the entire argument. It is not that the spreadsheet was wrong. It is that four plans out of 1,622 is a 0.2% sample, and the difference between the best and the middle of the rest is larger than most people assume.
The part that makes our own product look worse
Here is the uncomfortable bit, and it stays in because leaving it out would make everything else here less believable. The plan that spreadsheet picked cost about $85 a month on those usage figures. Nothing available to that household today beats it.
That is not the spreadsheet outperforming us — it is a price that no longer exists, and no comparison service can find you one of those. But the reason it no longer exists is not the one most people assume, and it is worth a section of its own.
What a comparison can do is make sure that, at any given moment, you are on the best of what actually exists. That is a smaller claim than "we will always save you money", and it is the only one that is true.
It was not the price of electricity. It was the connection fee
The obvious explanation is that power got more expensive. For this household, on a like-for-like plan, that is not what happened. We took the plan the spreadsheet chose in 2023 and lined it up against the closest equivalent available today — a flat-rate plan carrying the same 12 cent feed-in tariff — and compared the three numbers that decide the bill.
The usage rate went from 36.95c to 36.41c per kilowatt-hour, GST included. That is a fall of about 1%. The feed-in tariff is unchanged: 12 cents then, 12 cents now, if you pick the right plan. And the daily supply charge went from 103.5c to 182.8c a day — a rise of 77%.
Run those through the same 31-day period and the arithmetic is stark. Usage cost this household $3.03 LESS than it did in 2023. The supply charge cost $24.60 more. Net, the bill is about $21.57 a month worse, and the daily connection fee accounts for more than all of it.
That is the number almost nobody shops on. Households compare cents per kilowatt-hour, because that is the figure retailers advertise and the one that feels like it should matter. The daily supply charge is a fixed cost you pay for being connected at all — it does not fall when you use less, it is not reduced by solar, and for a low-import household like this one it is the dominant term. The 2023 spreadsheet did have a row for it. Most people looking at plans do not.
Seven things a hand-built sheet cannot see
The spreadsheet modelled five variables per plan. A real bill has considerably more moving parts, and each of the following changes which plan wins:
- Conditional versus guaranteed discounts. A large pay-on-time discount is worth nothing on a bill you pay late. A sheet that records one headline rate cannot tell the two apart.
- Benefit periods. Most competitive plans guarantee their rate for a fixed window, often around twelve months, then roll onto higher ongoing rates. A sheet records the rate on the day you typed it.
- Membership and subscription fees. Wholesale retailers charge a flat monthly fee on top of pass-through energy. Omit it and their plans look cheaper than they are.
- Percentage-of-bill fees. Card surcharges and similar charges are published by some retailers and not others, so including them naively penalises whoever discloses the most.
- GST basis. Residential rates are usually quoted GST-inclusive and much regulated comparison data is not. Mixing the two puts every figure out by about 9%, which is wider than the gap between many plans.
- Seasonal and tiered structures. Some networks have no peak window at all in the shoulder months. Some feed-in tariffs pay a premium rate only up to a daily cap, or only at certain hours. A flat cents-per-kilowatt-hour cell cannot represent either.
- Eligibility. A sizeable share of plans are restricted — to seniors, to members of something, to new customers only, or to households with particular equipment. A sheet will happily rank a plan you cannot actually join.
What replaced it
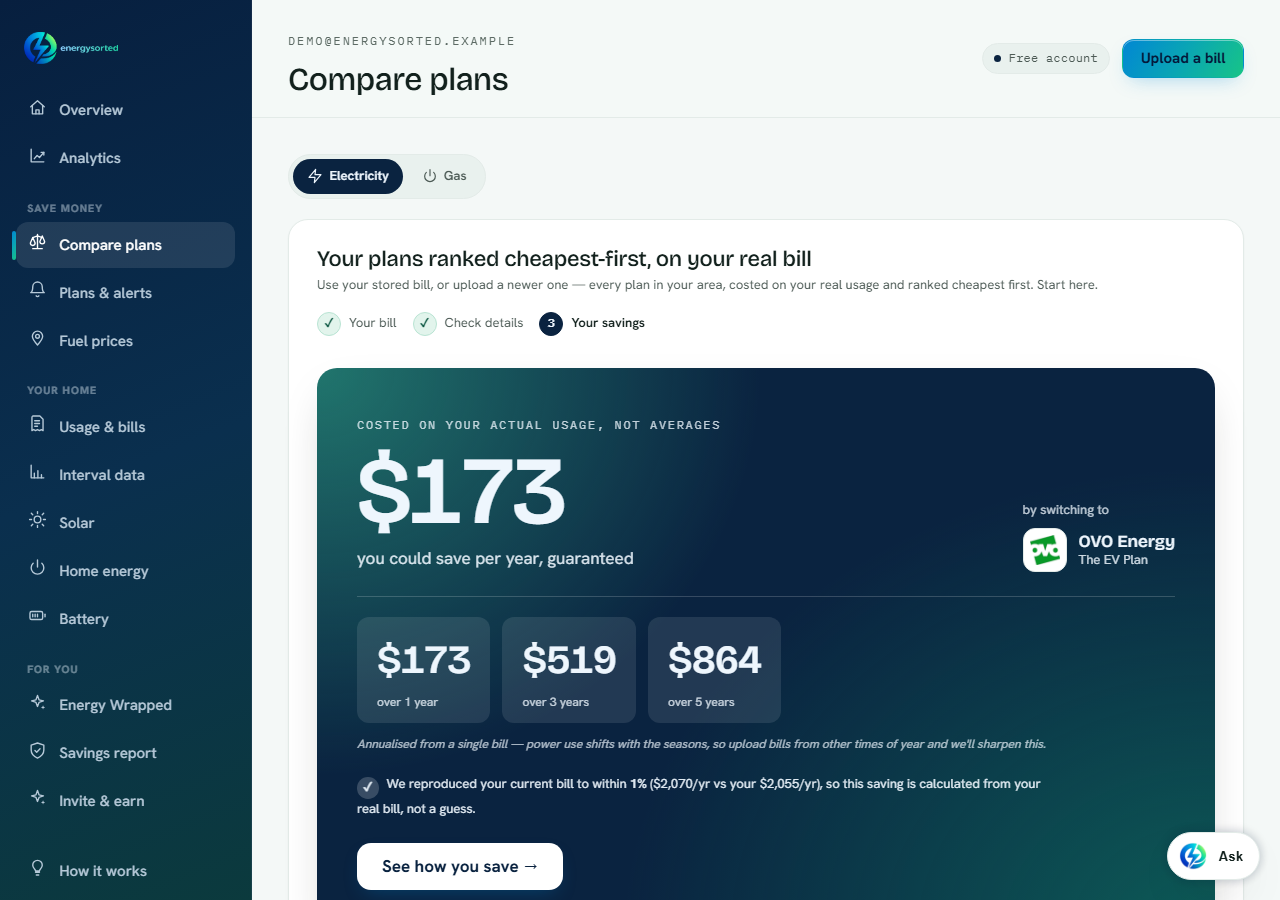
The product this became does exactly what the spreadsheet did, with the same arithmetic, and then keeps going. It reads the usage off your bill rather than asking you to type it, so the band split comes from the document instead of your patience. It costs every plan in your area rather than the four you had time for. It applies the discounts, fees, feed-in structures and eligibility rules above, because they are in the regulator's published data and there is no reason not to. And it re-checks nightly, so an expiring benefit period reaches you as an alert rather than as a surprise three bills later.
It also proves its reading against the bill you already paid before it recommends anything, which is the one check a spreadsheet can never do on itself — a typo in a rate cell produces a confident, wrong answer with nothing to catch it.
If you would like to see the same thing on your own numbers, upload one recent bill. If you would rather start with an estimate, the free electricity bill estimator needs no account, and the appliance running-cost calculator shows which of your appliances is actually driving the total.
Frequently asked questions
Can I just compare energy plans in a spreadsheet myself?
You can, and the arithmetic is not hard: rate times usage for each band, plus the daily supply charge, minus your feed-in credit. The limits are scope and maintenance — four or five plans is about what anyone sustains by hand, and every rate change makes the sheet stale.
How many electricity plans are actually available to one household?
More than most people expect. For the household in this article — a solar home on the Ausgrid network in New South Wales — 1,622 plans from 28 retailers could be costed on its usage on 22 September 2026. The catalogue changes constantly, so that figure is a snapshot rather than a constant.
How much difference does picking the right plan make?
For this household, about $110 a month between the cheapest plan available and the median one, which is roughly $1,300 a year. Your own gap depends on your usage, your state, your tariff type and how much solar you export — it is not a figure that transfers between households.
Why can a comparison not beat a plan I was on years ago?
Because a price that is no longer offered cannot be found — a comparison shows you the best of what exists today, which is a genuinely different claim. In this case the culprit was specific: comparing the 2023 plan against its closest equivalent now, the usage rate fell about 1% and the feed-in tariff was unchanged, but the daily supply charge rose 77%. The fixed connection fee, not the price of electricity, is what moved.
Why did my usage rate stay flat but my bill go up?
Look at the daily supply charge. It is a fixed amount you pay for every day you are connected, whatever you use, and it has risen sharply on many plans. It does not fall when you use less and solar does not offset it, so for a low-import or high-export household it can be the largest single term in the bill. Comparing plans on cents per kilowatt-hour alone will miss it entirely.
What does a comparison catch that a spreadsheet does not?
Conditional versus guaranteed discounts, benefit-period expiry, membership and subscription fees, percentage-of-bill charges, GST basis, seasonal and tiered rate structures, and eligibility restrictions. Each of those can change which plan is genuinely cheapest, and none of them fit in a single cents-per-kilowatt-hour cell.